Occupational Therapy in Numbers
Annual Changes in Number of Occupational Therapist Schools,
Licensed Therapists, OTs per hundred thousand of population, JAOT members
|
|
No. of schools | No. of licensed OTs | No. of OTs per 100,000 | No. of JAOT members | Rate of organizations |
|---|---|---|---|---|---|
| 1966 | 2 | 22 | 0.0 | 18 | 82% |
| 1967 | 2 | 72 | 0.1 | 54 | 75% |
| 1968 | 2 | 132 | 0.1 | 103 | 78% |
| 1969 | 3 | 222 | 0.2 | 150 | 68% |
| 1970 | 3 | 311 | 0.3 | 200 | 64% |
| 1975 | 4 | 569 | 0.5 | 383 | 68% |
| 1980 | 13 | 991 | 0.8 | 752 | 76% |
| 1981 | 17 | 1,101 | 0.9 | 842 | 77% |
| 1982 | 21 | 1,268 | 1.1 | 994 | 78% |
| 1983 | 24 | 1,458 | 1.2 | 1,022 | 70% |
| 1984 | 27 | 1,763 | 1.5 | 1,167 | 66% |
| 1985 | 28 | 2,154 | 1.8 | 1,386 | 64% |
| 1986 | 30 | 2,595 | 2.1 | 2,046 | 79% |
| 1987 | 30 | 3,020 | 2.5 | 2,414 | 80% |
| 1988 | 29 | 3,539 | 2.9 | 2,870 | 81% |
| 1989 | 29 | 4,095 | 3.3 | 3,387 | 83% |
| 1990 | 33 | 4,706 | 3.8 | 3,909 | 83% |
| 1991 | 33 | 5,301 | 4.3 | 4,391 | 83% |
| 1992 | 36 | 5,841 | 4.7 | 4,901 | 84% |
| 1993 | 44 | 6,415 | 5.1 | 5,457 | 85% |
| 1994 | 48 | 7,042 | 5.6 | 6,027 | 86% |
| 1995 | 58 | 7,722 | 6.1 | 6,618 | 86% |
| 1996 | 72 | 8,762 | 7 | 7,472 | 85% |
| 1997 | 81 | 9,822 | 7.8 | 8,400 | 86% |
| 1998 | 93 | 11,049 | 8.7 | 9,479 | 86% |
| 1999 | 97 | 12,640 | 10 | 10,914 | 86% |
| 2000 | 107 | 14,894 | 11.7 | 12,932 | 87% |
| 2001 | 119 | 17,243 | 13.5 | 15,020 | 87% |
| 2002 | 132 | 19,830 | 15.5 | 17,279 | 87% |
| 2003 | 143 | 22,769 | 17.8 | 19,849 | 87% |
| 2004 | 152 | 26,083 | 20.4 | 22,841 | 88% |
| 2005 | 156 | 29,525 | 23.1 | 25,890 | 88% |
| 2006 | 159 | 33,710 | 26.3 | 29,185 | 87% |
| 2007 | 169 | 38,110 | 29.8 | 32,557 | 85% |
| 2008 | 176 | 42,369 | 33.1 | 35,526 | 84% |
| 2009 | 179 | 47,776 | 37.3 | 38,569 | 81% |
| 2010 | 172 | 53,094 | 41.5 | 41,629 | 78% |
| 2011 | 176 | 57,232 | 44.8 | 44,448 | 78% |
| 2012 | 175 | 61,869 | 48.5 | 45,345 | 73% |
| 2013 | 182 | 65,949 | 51.8 | 47,476 | 72% |
| 2014 | 181 | 70,689 | 55.6 | 49,027 | 69% |
| 2015 | 184 | 74,815 | 58.9 | 51,262 | 69% |
| 2016 | 186 | 80,159 | 63.2 | 54,999 (as of March,2017) |
69% (as of March,2017) |
Gender Composition of Occupational Therapists
As of March 2015, Japanese occupational therapists include about 36% men and about 64% women.
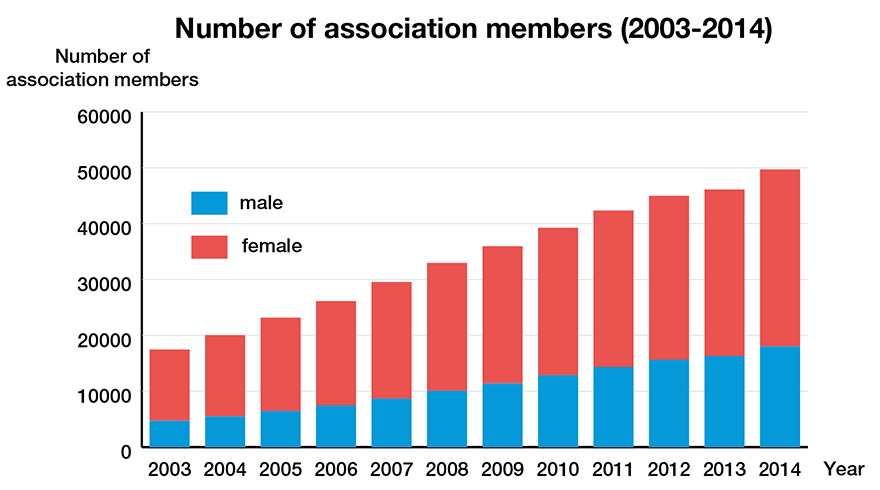
(according to 2014 JAOT member statistics)
Age Composition of Occupational Therapists
Most of Japanese occupational therapists are aged 26 through 30 (about 30%); those aged form 26 through 35 account for about half. The average age is 33.16 for men, and 32.45 for women.
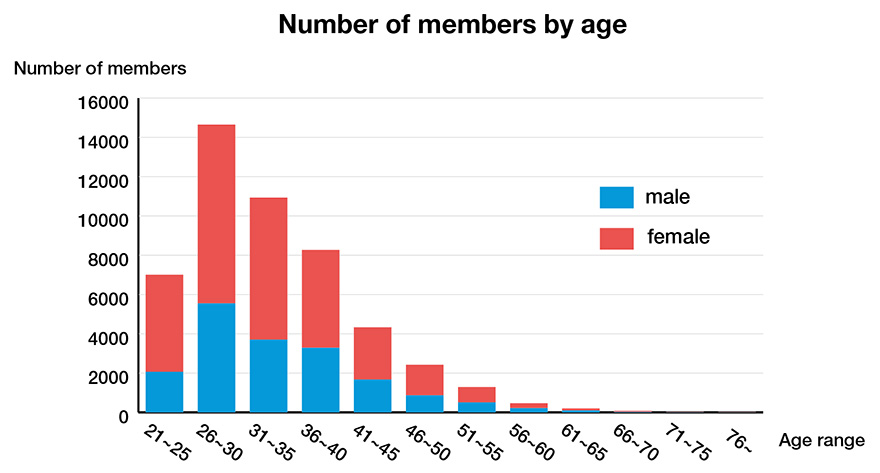
(according to 2014 JAOT member statistics)
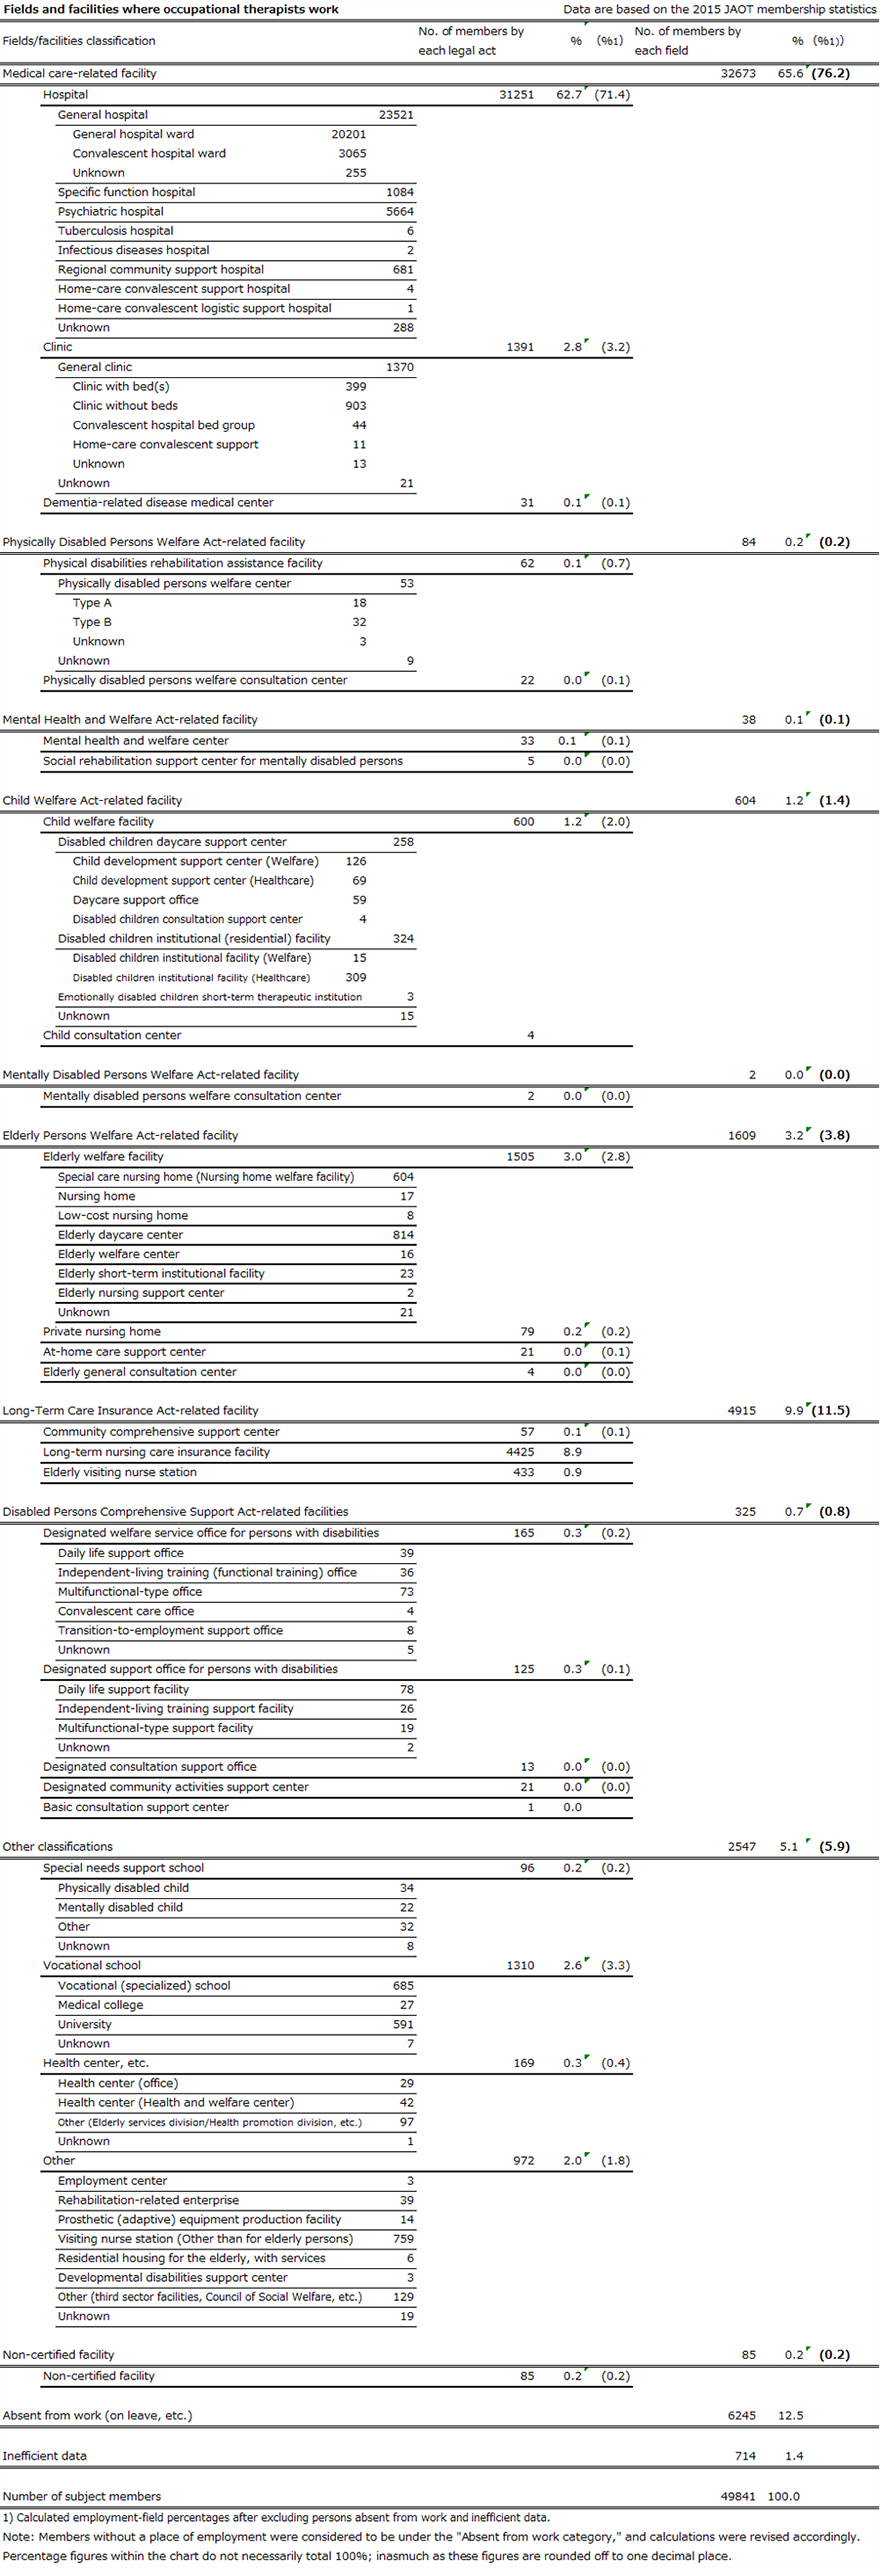
Affiliation of Occupational Therapists
As regards place of employment of Japanese occupational therapists, about 26,000 persons are employed by healthcare corporations, which make the largest share of 53%; next come national and municipal public agencies (12%), and NPO and other organizations (8%). In terms of main professional duties, clinical work accounts for 83%, and then comes education with 3%.
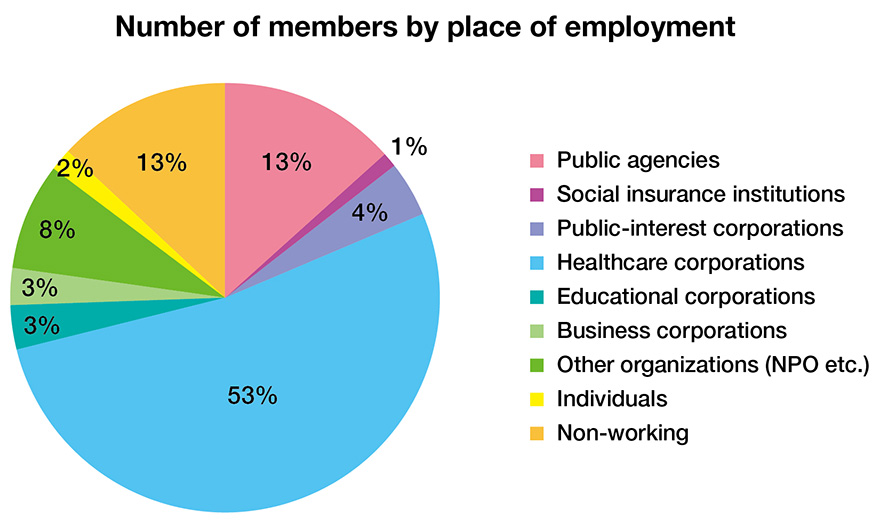
(according to 2014 JAOT member statistics)
Field of Specialization of Occupational Therapists
In specialization of Japanese occupational therapists, physical disabilities account for 59%; then come senile disorders and mental disorders with 14% and 14%, respectively.
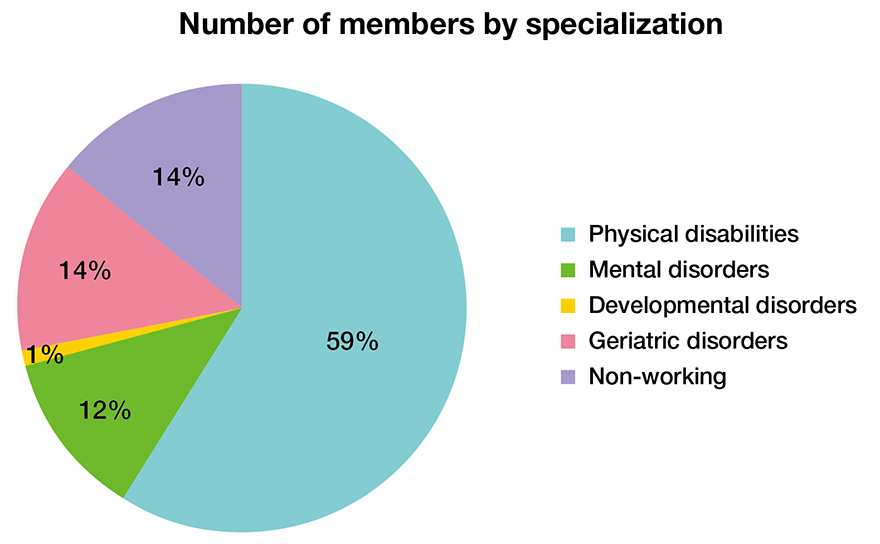
(according to 2014 JAOT member statistics)